What is Google Analytics data?
Google Analytics 4 (GA4) is the next generation of Google Analytics. In Google Analytics, a property is a website, mobile application, or blog, etc. that is associated with a unique tracking ID. GA4 is a new property with a new data model, reports, and features. GA4 is designed to give you a more complete picture of your customers across devices and platforms.
If you're looking for a more comprehensive and predictive view of your customers, then GA4 is the right choice for you. Not only is website and app data available, but the data is event-based rather than session-based in order to better understand your customer’s journey. GA4 also includes privacy control such as cookieless measurement, and behavioural and conversion modelling.
Key benefits
- It's cross-platform: GA4 can track data from websites, apps, and offline sources.
- It's predictive: GA4 uses machine learning to help you identify trends and patterns in your data.
- It's customisable: GA4 lets you create custom reports and dashboards to meet your specific needs.
GA4 vs Universal Analytics
GA4 brings several advancements and features that differentiate it from its predecessor, Universal Analytics. Here are the key differences between the two:
|
GA4 |
Universal Analytics |
|
|
Cross-Platform Tracking |
Allows seamless tracking across websites and mobile applications in the same property. |
Requires separate properties for tracking websites and mobile applications. |
|
Machine Learning and Predictive Analytics |
Integrates machine learning capabilities to predict future actions users may take. |
Does not inherently offer predictive capabilities. |
|
Raw Data Extraction |
Offers a straightforward connection to BigQuery, allowing users to automatically export raw, unsampled event data. |
BigQuery integration is only available with the premium GA 360 suite, and the data is often in a processed and aggregated form. |
All in all, GA4 uses an event-driven model that is more flexible, focusing on user actions/interactions or 'events'. Whereas, Universal Analytics uses a session-based model that focuses on pageviews and sessions.
Why is it beneficial to derive your own insights from GA4 data instead of using pre-packaged fields?
Even though pre-packaged fields (aggregated by GA4 using raw data) are useful for quick insights and general reporting, customisation through data transformation ends up being better for many reasons:
- Custom analysis: With the raw data, you can customise events within Google Analytics as well as metrics that are specific to your business needs. You can include your business logic as you perform transformations and you can capture the granularity of unique user behaviour, which you cannot do with pre-packaged field data
- Integration with other data sources: There is greater flexibility with raw events data if you want to combine it with other data sources (eg. CRM, sales data and other marketing tools)
- Future-proofing: Pre-packaged fields can change overtime, but with access to the raw data you can always reproduce reports and metrics which ensures consistency in your reporting
- Machine learning and predictive analytics: If you're looking to build machine learning models or conduct advanced statistical analysis, raw data can be more useful
- Data Governance: Storing and analysing your own raw data in BigQuery will mean you will have better control over data privacy
How to extract data from Google Analytics to BigQuery?
Loading GA4 data into BigQuery provides the advantage of powerful, customised querying for more in-depth analysis. Furthermore, integrating GA4 data with other datasets in BigQuery allows for comprehensive user-behaviour insights across various data sources, thereby supporting data-driven decisions.
To start on your journey to transform Google Analytics data and derive actionable insights, you need to first get the data from GA4 to BigQuery using the following steps:
- Go to the GA4 property: Sign in to Google Analytics and navigate to the GA4 property (e.g. Multiple Websites, Websites and Mobile App) you want to link to BigQuery.
- Navigate to 'BigQuery Linking': Click on 'Admin' (the gear icon) in the lower left corner, then under the property column click on 'BigQuery Linking'.
- Start the linking process: Click on 'New Link', then choose the Google Cloud project that contains the BigQuery dataset.
- Choose the location: Select the location of your BigQuery dataset. The location must be the same as the one you selected when you created your BigQuery project.
- Set up the link: Enter the link name and choose the data streams you want to link.
- Set up the frequency and mode of the data exports: Choose either a daily export or a streaming export for your data. For reporting, we typically recommend daily.
- Create the link: Click on 'Create Link'.
- Review and complete the setup: After the link is created, review the setup to ensure that everything is correct. It might take a few hours for the data to appear in BigQuery.
Unnesting in BigQuery
Once you start streaming Google Analytics data into BigQuery, you will notice two different things:
- The table is sharded/partitioned by date, i.e. each data is a separate table.
- Many of the fields are nested, e.g. event_params.
You can see in the image below some of the partitions available:
To get all of the data in all of the tables, you can use a wildcard asterisk in your SQL from statement. This will ignore the date at the end of the event name and will ingest all of the event tables, despite their date.

This is the first stage to clean the Google Analytics data, then we need to unnest it so that it is in a usable format. For this example we will be unnesting the event_params struct which contains both a key and values with different data types (integer, string, float, and double). This is a very useful column because it contains multiple event parameters related to a single user interaction. Each event parameter typically includes key-value pairs such as 'event_category', 'event_label', ‘ga_session_id’, ‘ campaign_id’, ‘page_location’, and ‘source’, among others, providing detailed information about the specific attributes of the event.
You can see below an example of a session_start event and all of its event_params, which include various keys e.g. page_title and their respective values:
In order to unnest each of the event_params, we need to consider which of the value fields (e.g. event_params.value.string) are being populated as each event_params only populates one of the value columns - based on its datatype. For example, a ga_session_id will always only populate the value.int_value column as it is an integer.
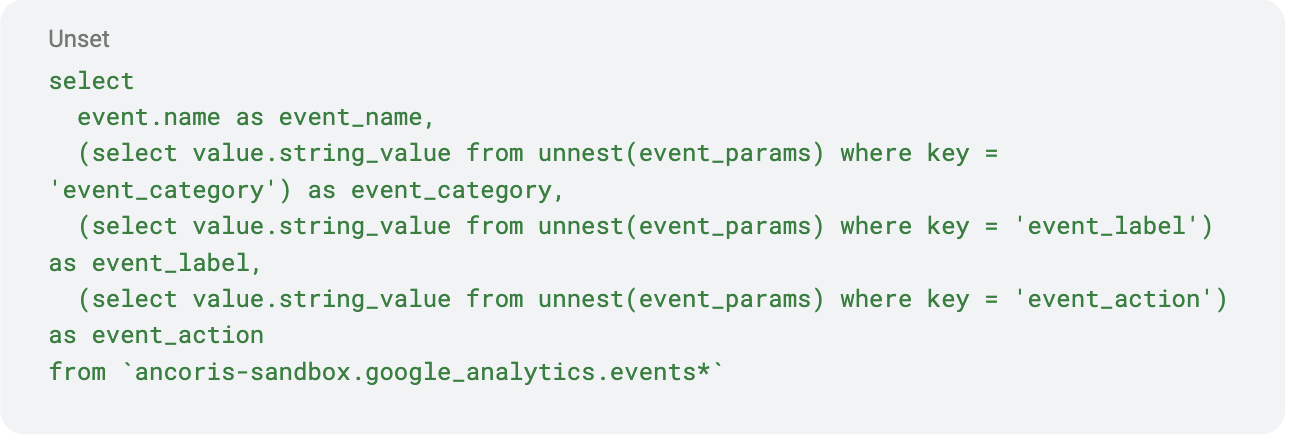
To unnest multiple columns at the same time, you need to have a nested query that selects from the column with the correct data type, then unnests event_params based on a corresponding key. For example, select value.string_value from unnest(event_params) where key = 'event_category'. In order to unnest all of the data, this needs to be repeated for all of the columns, an example code sample has been provided below:

Even though some of the fields do not require unnesting, such as device, they are still nested fields but all of the subfields have the same data types. As you can see below, the device includes category, mobile_brand_name, mobile_model_name but they are all strings.
If this is the case, you do not need to use the unnest function. You can call the record and the subfields in the following way:

The code above will yield the following results and there’s no need for the unnest function:
How can you start deriving your own insights from GA4 events data?
A significant advantage of utilising GA4 is the centralisation of data. It allows the aggregation of marketing information from a multitude of sources all within the GA4 platform. Examples may include LinkedIn Ads and Google Ads, among others. Thus, it may be useful to derive key performance metrics both from each platform individually and also across all platforms.
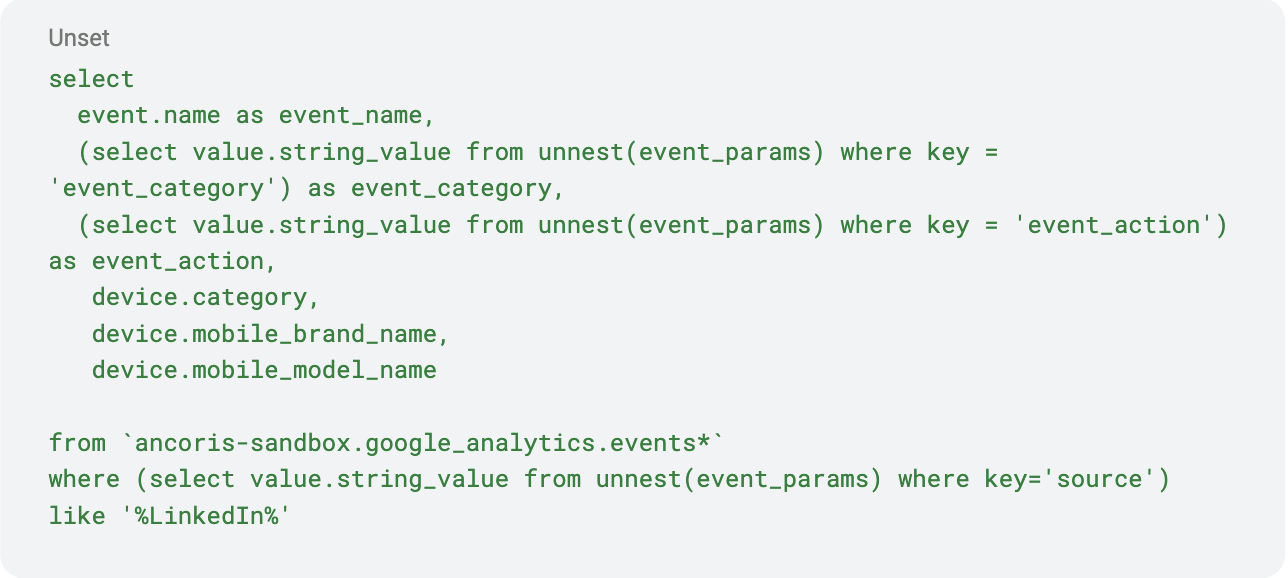
If you wanted to analyse LinkedIn data ingested from your GA4 events dataset, it could be beneficial to generate a new table derived from the initial one, applying the following condition:

The provided code not only selects the relevant columns, but it also selectively pulls rows where the name of the source contains 'LinkedIn'.
Additionally, you can look at performance across marketing platforms. The Kimball methodology, a data warehousing approach by Ralph Kimball, distinguishes data into two types: facts and dimensions. Facts are measurable, quantitative data points that usually involve a numerical value, whereas dimensions provide context to these measurements. Below are some facts and dimensions that can be derived from GA4 data.
Facts
- Sessions: The number of user interactions within a given time frame.
- Users: The total number of users who have interacted with the website or app.
- Pageviews: The total number of pages viewed.
- Bounce Rate: The percentage of single-page visits.
- Session Duration: The amount of time spent on the website during a single session.
- Events: User interactions with content that can be tracked independently from a web page or a screen load. Examples are button clicks, form submissions, etc.
Dimensions
- User Type: New or returning user.
- Source: The origin of your traffic, such as a search engine or a referring website.
- Device Category: The type of device used to access your site. For example, desktop, mobile, tablet.
- Country/City: Geographic location of the user.
- Page Path: The page on your site the user is viewing
Concluding remarks
If you have any questions or want to get started on your GA4 analysis journey, feel free to get in touch with us. As a Google Cloud Partner who work day in and day out with data, Ancoris is well-placed to help you unlock the full potential of your data and help you meet your business needs. Feel free to contact us (Carolina Morais or Juliette Bessiron!) or the wider team for anything on Google Cloud – we’re here to help. Think big, start now – get in touch with us today,
